When you’re collecting information from your website visitors, IBM Cognos Dashboard makes this easy by breaking down data into manageable, real-time visualizations. This simplicity helps you create solutions that perfectly fit your company’s needs.
With Cognos Dashboard Embedded (CDE), an API-based tool, developers no longer struggle to turn data into visuals or rely on cloud-based solutions. CDE integrates a visualization solution directly into the application. This article discusses how CDE works and highlights its key features.
Cognos Dashboard Embedded is essential for turning complex data into understandable metrics. It converts data into graphs and charts. The real-time tracking of performance indicators enhances this understanding, allowing you to gather relevant information from various sources.
CDE accepts CVS files with comma delimiters, as well as formats like Db2, Db2 on the cloud, Db2 warehouse, IBM cloud database for PostgreSQL, PostgreSQL, and Microsoft SQL. Your CVS files can’t exceed 128 characters.
You can gain insights and share your findings with others in and out of your organization through a URL link. Installing the software is straightforward. A detailed Cognos dashboard tutorial can guide you through setting up your profile.
Dashboard provides a comprehensive view of your data. An active IBM account is needed to get started. The interactive title tool allows you to engage with your data through straightforward steps. Toggle between different graphs and charts to find what works best for your organization. Schematics let you add diagrams to further interpret your data.
Pin important insights from your dashboard to easily highlight crucial data. Add frequently-used tools to the dashboard for quick access. Use filters to sort through specific sections of your data, either in ascending or descending order.
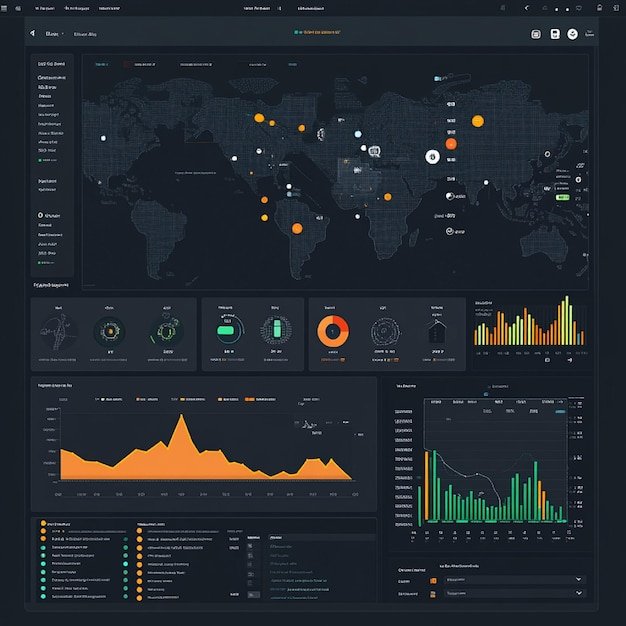
The Cognos dashboard is a powerful tool for visualizing data from multiple sources. Users can create dashboards with charts, graphs, maps, tables, and gauges. Cognos Dashboard Embedded (CDE) allows developers to easily integrate these features into their applications.